“Labor earnings to total personal income” is a good proxy for how dynamic or robust an economy is. Across the country, the share of labor earnings (active work) relative to total personal income has been dropping reflecting both an aging and stagnating economy. A healthy labor-earning rate is in the range of 60 to 70%.
Source: Development Opportunity Profile (The Center for Rural Entrepreneurship, Dec 2018)
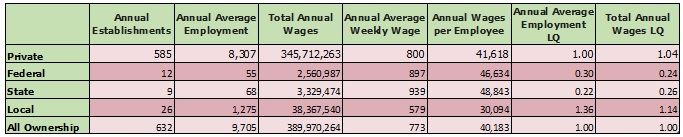
The table below provides information concerning Pottawatomie County’s annual labor force and employment statistics. This information was derived from the Bureau of Labor Statistics Quarterly Census of Employment and Wages. Location Quotients (LQs) are ratios that allow an area’s distribution of employment by industry to be compared to a reference or base area’s distribution. LQs also allow areas to be easily compared to each other.
If an LQ is equal to 1, then the industry has the same share of its area employment as it does in the reference area. An LQ greater than 1 indicates an industry with a greater share of the local area employment than is the case in the reference area. For example (assuming the U.S. as the reference area), Las Vegas will have an LQ greater than 1 in the Leisure and Hospitality industry because this industry makes up a larger share of the Las Vegas employment total than it does for the country as a whole.
Pottawatomie County Labor Force and Employment Statistics (2019 Annualized data):
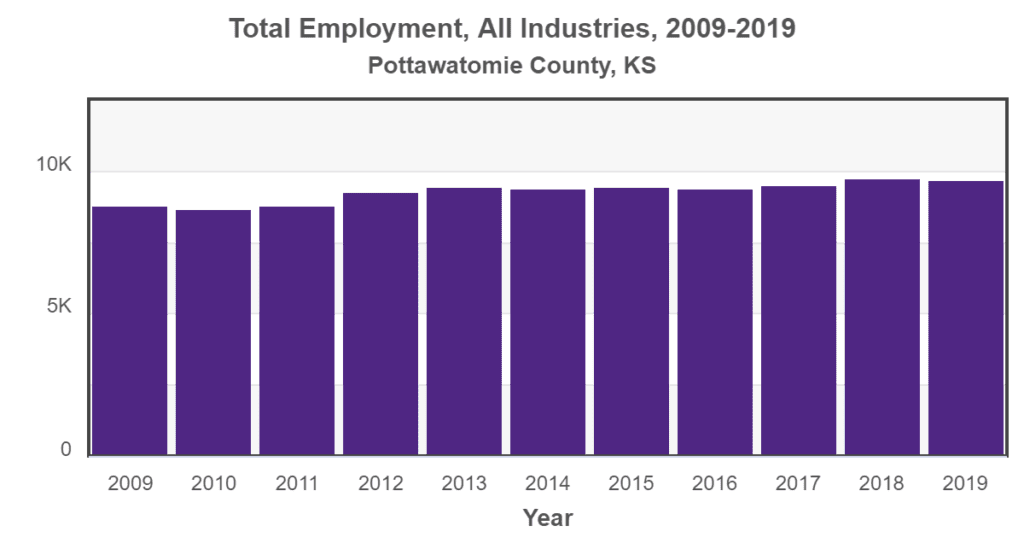
Annual Employment Data:
(Greater Manhattan Economic Partnership, 2019)
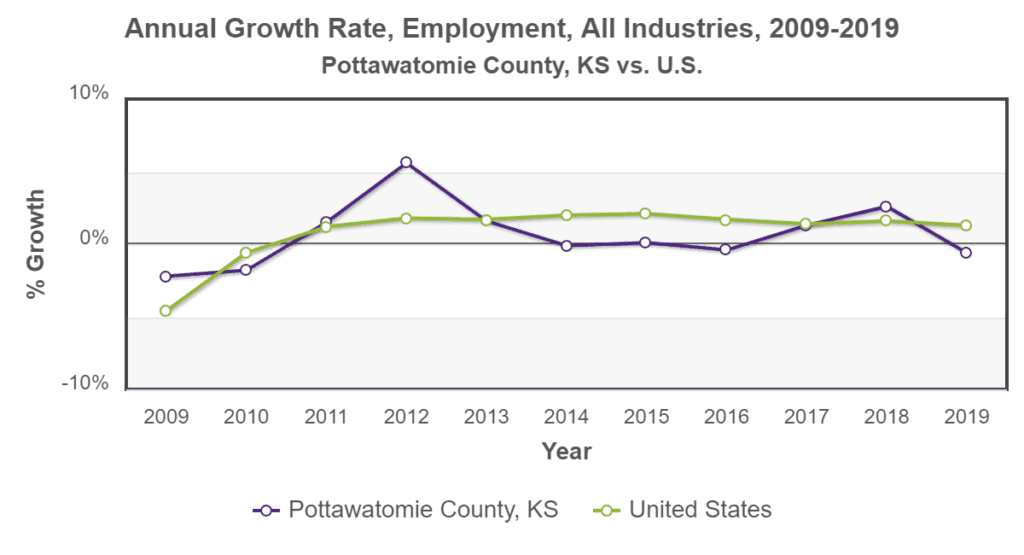
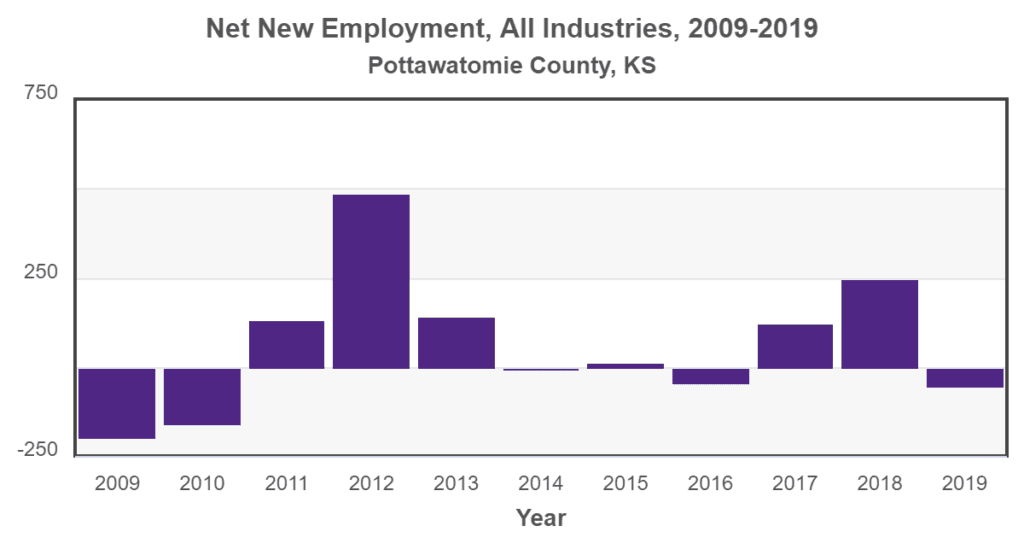
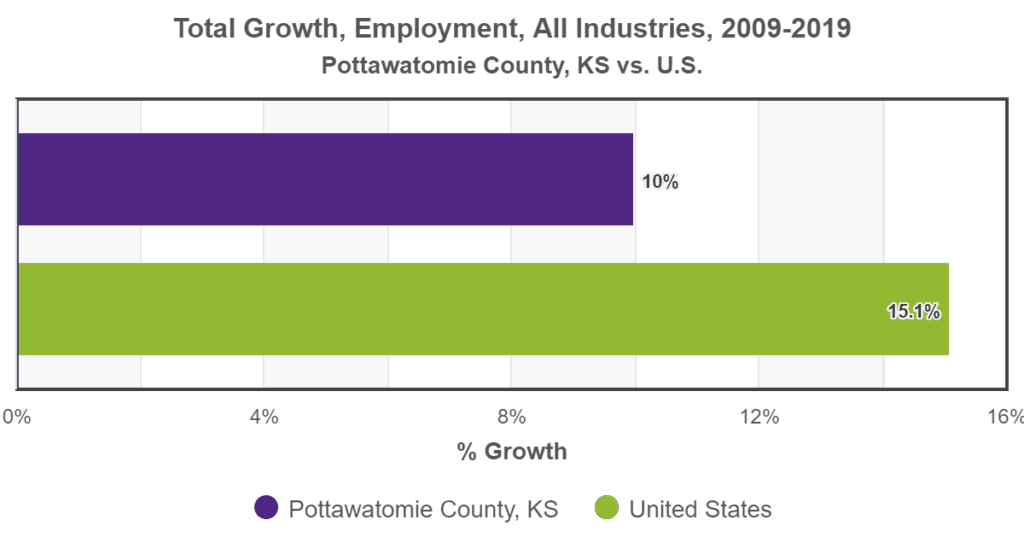
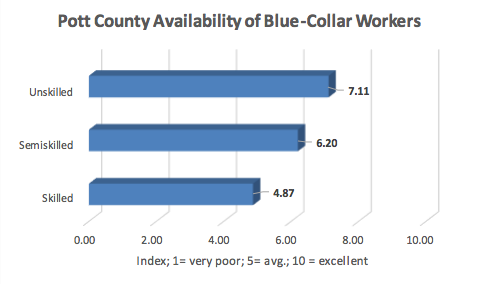
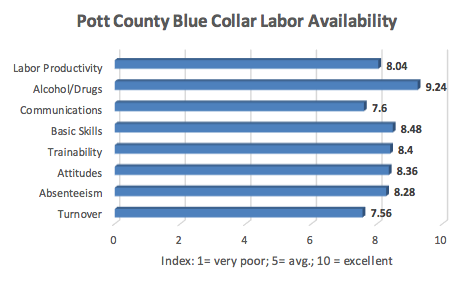
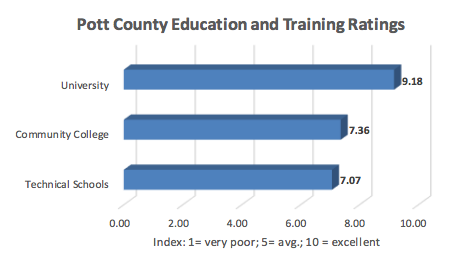
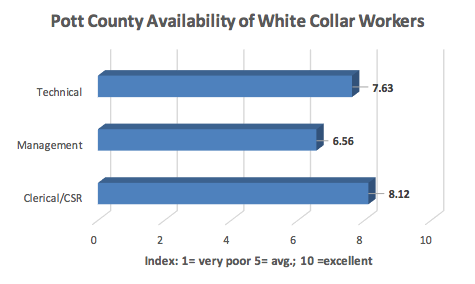
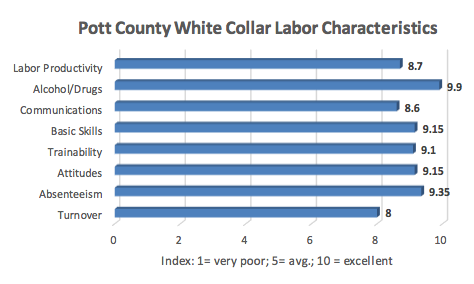
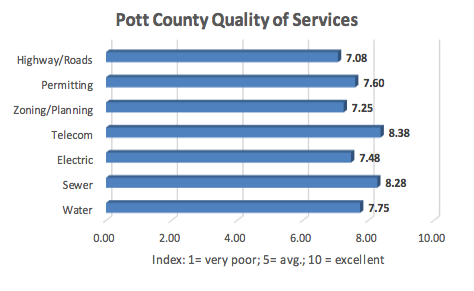
PCEDC Labor Force Reports:
The charts below are the result of field work completed by the Pottawatomie County Economic Development Corporation.