Sample Salaries

Manhattan Statistical Area Wage Data

The most recent Manhattan Statistical Area (MSA) wage data is available in the table below. Click here to download a full version of the table in a new tab.

Sample Salaries by City

The tables below provide sample salaries by occupation found in Manhattan, KS compared to other competitor cities.
(Survey Mean: 1-year Experience)  

Source: Economic Research Institute, Third Quarter 2018.

Manufacturing

Competitor Cities Welder (MIG) CNC Op
Manhattan, KS $17.35 $14.53
Colombia, MO $17.90 $15.08
Des Moines/Ames, IA $18.83 $15.90
Omaha, NE $18.79 $15.84
Sioux Falls, SD $17.56 $14.59
Denver, CO $20.67 $17.34
Kansas City, MO $19.95 $17.45
Chicago, IL $21.12 $17.55
Philadelphia, PA $21.40 $17.89

Computer

Competitor Cities Computer Technical Support Specialist CSR
Manhattan, KS $19.08 $10.52
Colombia, MO $19.23 $10.83
Des Moines/Ames, IA $20.87 $11.87
Omaha, NE $21.24 $11.42
Sioux Falls, SD $18.95 $10.63
Denver, CO $24.13 $12.97
Kansas City, MO $21.82 $11.96
Chicago, IL $23.96 $13.42
Philadelphia, PA $23.67 $12.80

Warehouse

Competitor Cities Warehouse Workers Inventory Control Planner
Manhattan, KS $10.43 $17.21
Colombia, MO $10.67 $17.75
Des Moines/Ames, IA $11.64 $19.33
Omaha, NE $11.45 $18.79
Sioux Falls, SD $10.83 $17.33
Denver, CO $12.42 $21.24
Kansas City, MO $11.84 $19.59
Chicago, IL $13.04 $21.69
Philadelphia, PA $12.64 $20.96

Animal Care

Competitor Cities Animal Health Scientist Animal Lab Tech
Manhattan, KS $21.73 $17.53
Colombia, MO $21.58 $17.87
Des Moines/Ames, IA $24.44 $19.47
Omaha, NE $22.89 $19.40
Sioux Falls, SD $21.80 $17.61
Denver, CO $24.96 $20.97
Kansas City, MO $23.41 $19.11
Chicago, IL $25.92 $21.35
Philadelphia, PA $25.62 $20.81

Pottawatomie County Salaries at a Glance

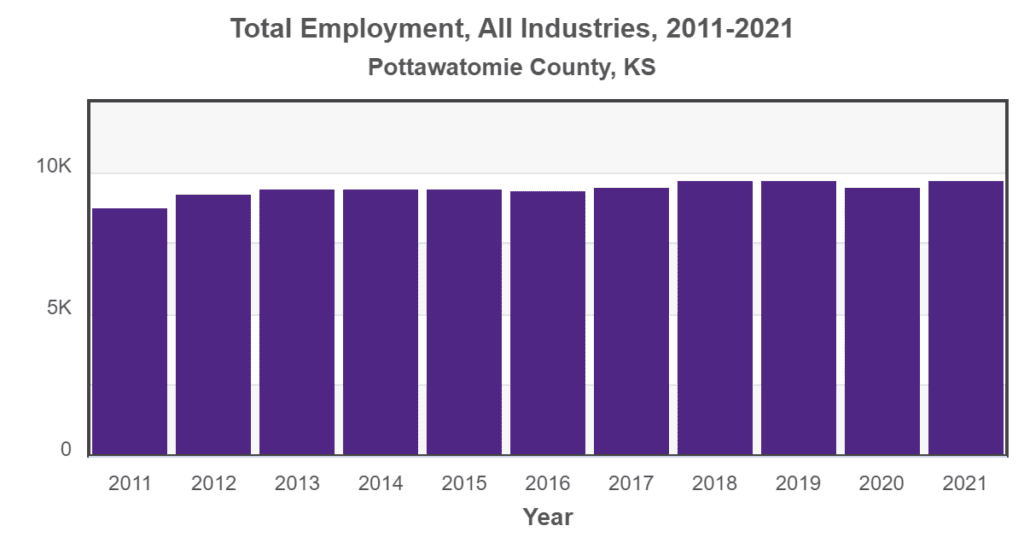
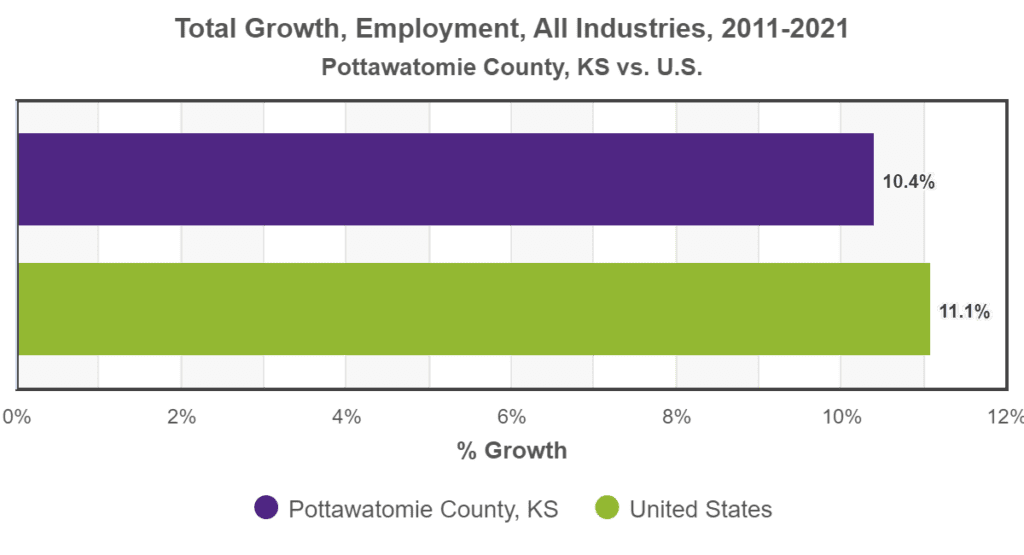
Source: BLS Current Employment Statistics (CES) – Retrieved from the Greater Manhattan Economic Partnership (GMEP) Data Center.

Notes: Does not include agriculture; includes state and metro data only.

Employment Statistics

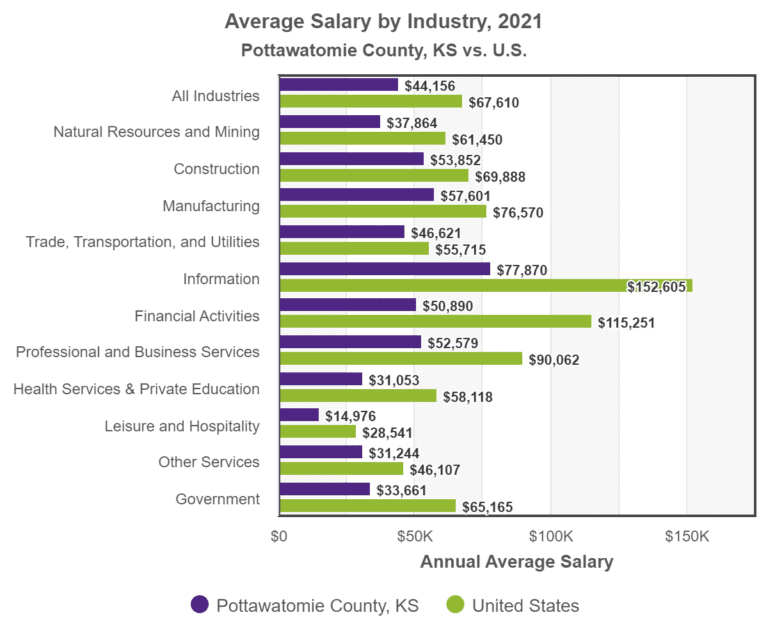
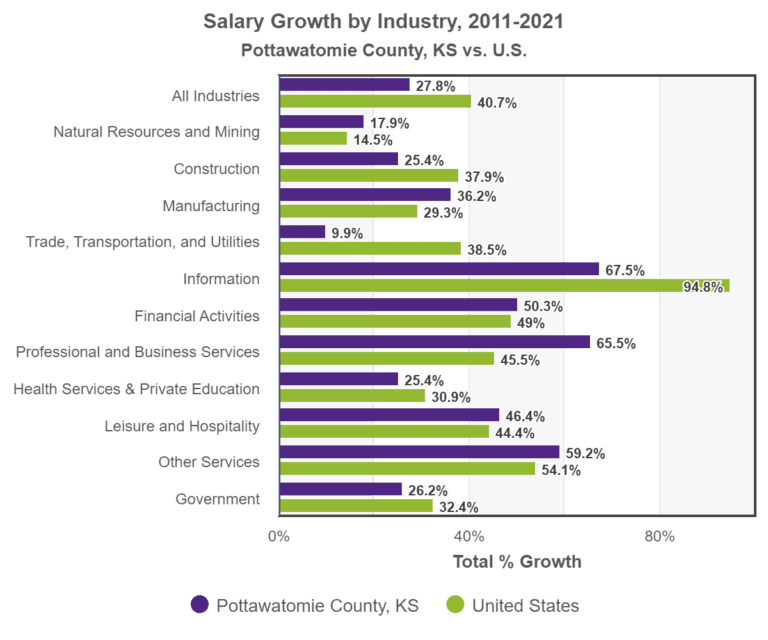
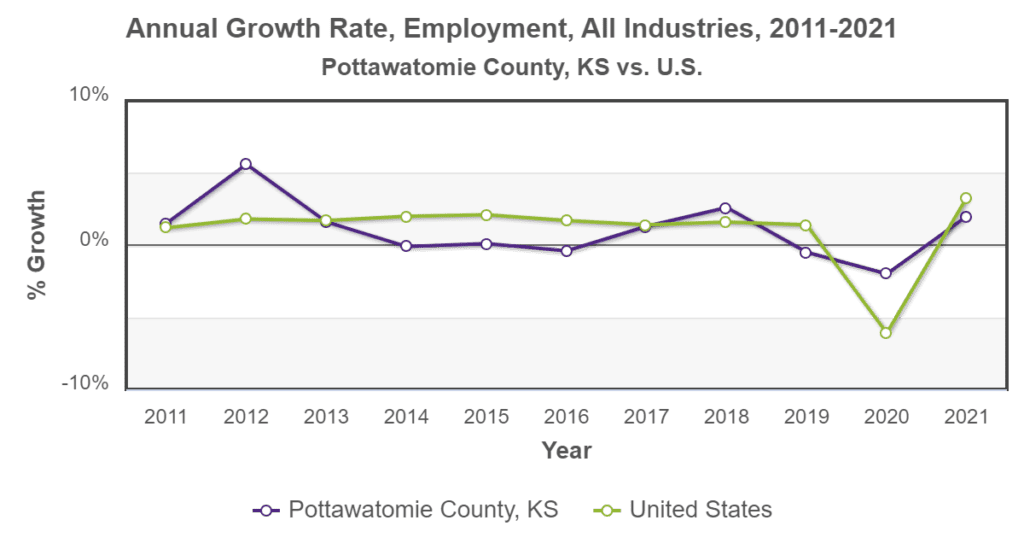
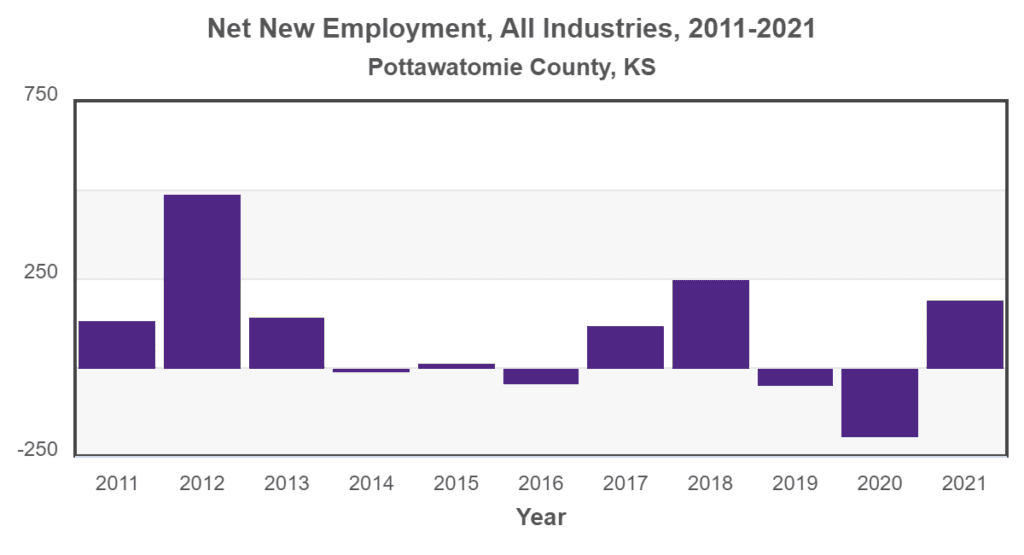
The following information is available through the GMEP Pottawatomie County annual employment dashboard:

Graph showing net new employment per year from 2011 to 2021 in Pottawatomie County, KS.
Graph showing the total employment in Pottawatomie County, KS, from 2011 to 2021.