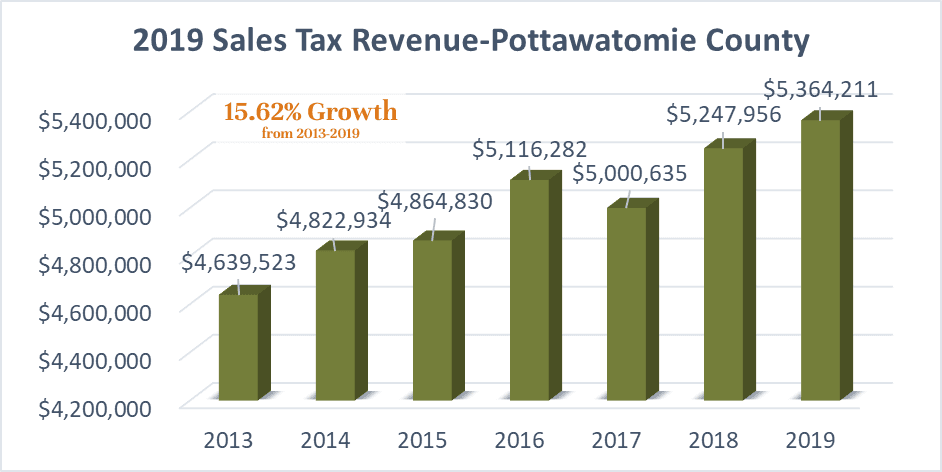
Retail Sales
County-Wide Retail Market Reports
The following analysis is based off of county-wide data and reports.
Pottawatomie County Retail Summary
Sales Tax by City
| January | February | March | April | May | June | Total CY 2019 | |
|---|---|---|---|---|---|---|---|
| Pottawatomie County | $458,961.01 | $470,103.91 | $389,822.67 | $387,335.59 | $433,197.05 | $440,225.21 | $2,579,645.44 |
| —Belvue | $2,210.52 | $2,258.85 | $1,873.09 | $1,861.14 | $2,081.50 | $2,115.27 | $12,400.37 |
| —Emmett | $2,078.42 | $2,116.88 | $1,755.25 | $1,744.05 | $1,950.55 | $1,982.19 | $11,627.34 |
| —Havensville | $1,622.66 | $1,652.89 | $1,370.63 | $1,361.89 | $1,523.14 | $1,547.85 | $9,079.06 |
| —Louisville | $2,087.16 | $2,135.68 | $1,770.79 | $1,759.49 | $1,967.82 | $1,999.75 | $11,720.69 |
| —Manhattan (Pott County) | $25,571.71 | $25,676.14 | $21,291.38 | $21,155.54 | $23,660.41 | $24,044.27 | $141,399.45 |
| —Olsburg | $2,327.85 | $2,374.02 | $1,968.53 | $1,955.97 | $2,187.56 | $2,223.05 | $13,036.98 |
| —Onaga | $8,787.2 | $8,862.87 | $7,349.44 | $7,302.55 | $8,167.19 | $8,299.69 | $48,768.94 |
| —Saint George | $12,635.12 | $13,022.35 | $10,798.42 | $10,729.52 | $11,999.92 | $12,194.61 | $71,379.94 |
| —St. Marys (Pott County) | $29,911.79 | $30,480.13 | $25,274.81 | $25,113.56 | $28,087.06 | $28,542.74 | $167,410.09 |
| —Wamego | $63,063.33 | $64,804.76 | $53,737.68 | $53,394.83 | $59,716.90 | $60,685.75 | $355,403.25 |
| —Westmoreland | $9,388.19 | $9,552.98 | $7,921.63 | $7,871.09 | $8,803.05 | $8,945.87 | $52,482.81 |
| —Wheaton | $1,115.84 | $1,137.65 | $943.50 | $937.48 | $1,048.48 | $1,065.49 | $6,248.44 |
| —Pottawatomie County | $298,161.22 | $306,028.71 | $253,767.52 | $252,148.48 | $282,003.47 | $286,578.68 | $1,678,688.08 |
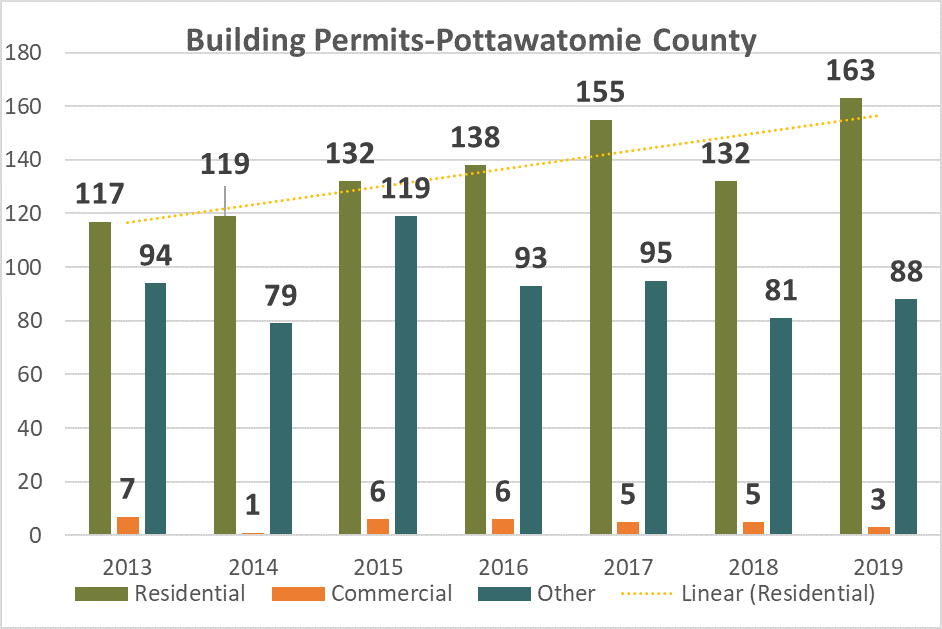
Pottawatomie County Retail & Investor Insights
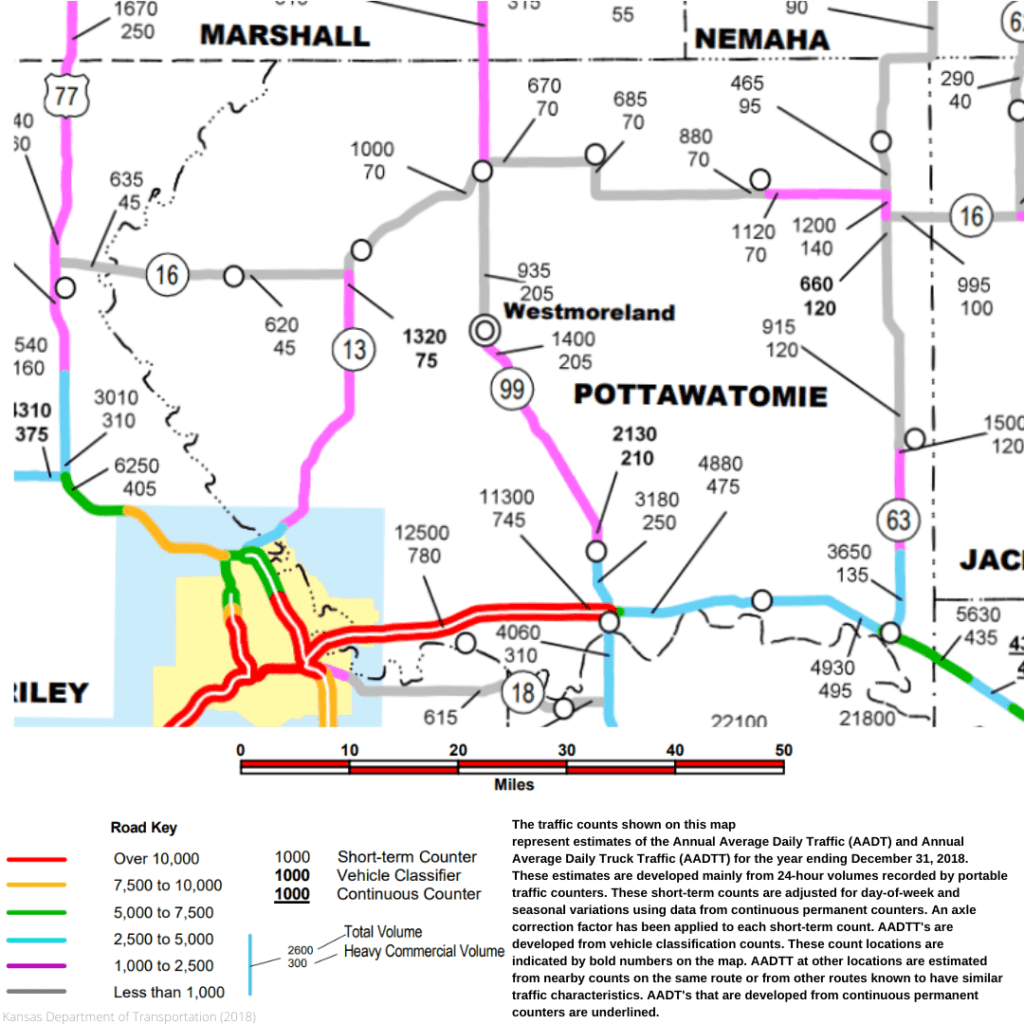
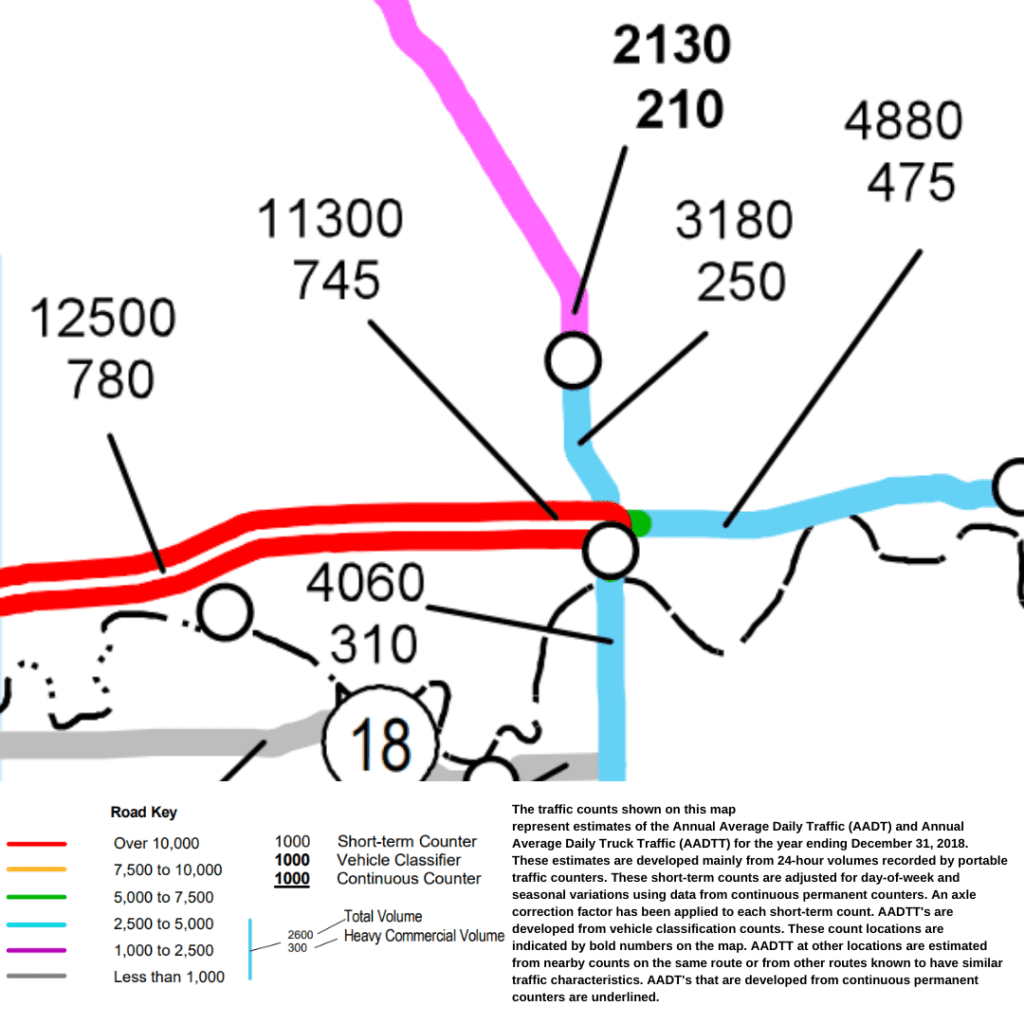
Traffic Counts: Pottawatomie County
Wamego Retail Market Reports
The following reports pertain specifically to Wamego:
Wamego MarketPlace Profile
Wamego Traffic Counts Map
Wamego Market Potential Profile
The following report was prepared by e2 Entrepreneurial Ecosystems, a hosted Initiative of NetWork Kansas.
Analysis Assumptions
This analysis is specific to the community of Wamego, Kansas as defined by its Zip Code area 66547.
Economic Development Plays. America is unique when compared to most developed economies throughout the world. In America, the primary responsibility for a community’s development resides with the community itself. Elsewhere in the world, provincial and national governments assume greater development responsibility. For communities in the United States, there are three primary economic development strategies:
- Base Economy.
- Quality of Life Amenities.
- Spending Capture.
Let’s explore each of these development strategies briefly and then focus on the third strategy – “spending capture” – for which this Market Potential Profile has been prepared:
Development Strategy 1 – Base Economy. The base economy refers to those activities that are rooted in the community–creating jobs and tax revenues by selling to consumers outside of the community. Every successful community requires basic economic activities.
Development Strategy 2 – Quality of Life Amenities. Competitive communities in today’s “human talent” environment, must also develop “quality of life amenity” activities to attract and retain residents. These activities are wide ranging from a great local coffee shop to recreational assets like a YMCA to essential shopping such as grocery stores.
Development Strategy 3 – Spending Capture. The third development strategy, often undervalued, focuses on increasing local spending capture. In today’s economic climate, where competition for consumer spending is so intense, working with local ventures to improve their competitiveness is a foundational development strategy. Increased local spending capture expands local business activity, increases locally rooted business owners (contributing to more leaders, volunteers and donors), and stronger property and sales tax bases.
Our Market Potential Profile provides critical information about the size and attributes of Wamego’s local spending potential.
Likely Local Spending Markets. Wamego (defined as Zip Code 66547) has five “local spending markets”:
- Permanent Residents
- For-Profit Ventures
- Nonprofit Ventures
- Governmental Entities (including public schools and health care)
- Visitors
The largest local spending market is associated with permanent residents and this is the focus of our Market Potential Profile. However, the other four spending markets are important and should be considered as potential customer groups for any prospective or expanding business. Travelling through consumers associated in Interstate Highway 70 also represent a major and growing consumer group for area businesses.
Our analysis primarily focuses on the spending potential of local permanent residents.
2018 Data Year. Our analysis is using purchased data from Esri (www.esri.com) employing 2018 calendar year data estimates.
Key Findings
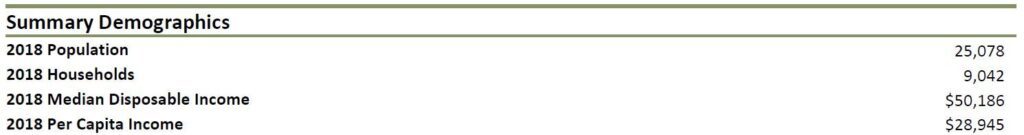
Permanent Resident Profile. The following provides the permanent resident profile for Wamego, Kansas:
- Population 8,903
- Households 3,369
- Families 2,381
- Individuals 988
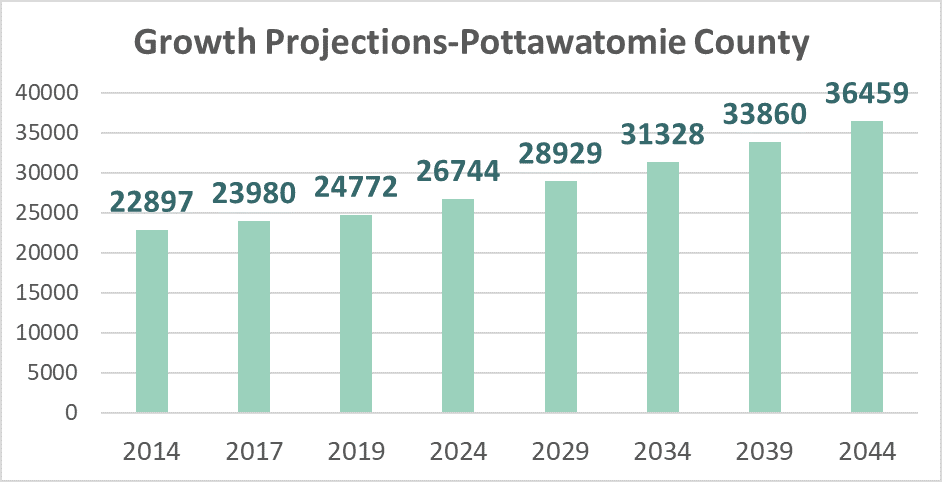
Wamego is experiencing very rapid demographic growth. Esri is projecting that Wamego’s population will grow by a very robust 1.69% per year over the next five years or 2018 through 2023. Household growth is comparable, but somewhat slower with Esri estimating household growth at 1.60% per year from 2018 through 2023. This projected rapid population growth will significantly expand domestic market potential over time.
For more detailed information about Wamego’s permanent residents check out the following profiles:
Now let’s begin to explore the domestic (permanent Wamego residents) market potential.
Domestic Spending Potential. America embraces a free market economic system. Consumer spending accounts for 70 to 80% (depending on the research employed) of all economic activity. The following provides information on the overall domestic spending potential for Wamego:
Household Disposable Income. Esri estimates 2018 Wamego household disposable income at $219 million. This is a significant amount. Wamego has a wide range of households with regard to their disposable income levels. Esri’s Disposable Income Profile provides more detailed information on Wamego’s households. This profile provides information about households based on their annual disposable income levels and information on disposable income by age cohort.
- Median Household Disposable Income $50,740
- Mean Household Disposable Income $65,116
- Median/Mean Ratio 1.28x
Note – Median values represent the value where half of the households have more or less disposable income. The mean value is the average or total disposable income divided by the total number of households. The ratio illustrates income equality. The lower the value the greater the income equality.
Household Wealth. Esri estimates 2018 Wamego household wealth at $2.2 billion. Household wealth represents accumulated income. Over time, this wealth will be spent. Some of this wealth may be used to build a dream retirement home, educate children and grandchildren, or travel and basic household needs from groceries to health care. Wamego has a wide range of households with regard to their household wealth levels. Esri’s Net Worth Profile provides more detailed information on Wamego’s households. This profile provides information about households based on their 2018 net worth (household wealth) and information on household wealth by age cohort.
- Median Household Net Worth $137,335
- Mean Household Net Worth $554,386
- Median/Mean Ratio 4.84x
Note – Household net worth or wealth is defined as total assets (e.g., home, business, savings, retirement funds, etc.) less debt. Median values represent the value where half of the households have more or less wealth. The mean value is the average or total wealth divided by the total number of households. The ratio illustrates income equality. The lower the value the greater the wealth equality.
Household wealth represents significant future spending potential by Wamego’s residents. Understanding how wealth is likely to be spent over time is recommended.
Esri produces a Market Profile providing comprehensive domestic market information. We have generated an Esri Market Profile for Wamego (Zip Code 66547). This profile provides both 2018 and estimated 2023 values for key market indicators. We recommend particular attention be paid to page 7 of this Profile where information on 2018 Consumer Spending by consumer category. This data provides three key indicators:
1. Total Estimated Consumer Spending by Category 2. Average Household Spending by Category
3. Spending Potential Index
Spending Potential Index or SMI. Based on Esri’s detailed profile of Wamego’s households, the Spending Potential Index provides insight into the spending potential for these consumer categories. A value of 100 means the spending potential is equal to the U.S. averages. Values below 100 mean less potential and values above 100 equate to higher potential.
Area Community. Wamego is part of a larger regional economy. There is significant commuting activity including both workers and shoppers. Wamego is estimated by Esri to have a daytime population of 7,223 compared to a permanent resident population of 8,903. Commuter data supports that there are significant number of Wamego residents working outside of the community. The composition of daytime population includes 2,409 workers and 4,824 residents (e.g., non-working elders, children, etc.). Wamego has strong relationships with Manhattan to the west, Topeka to the east, and I-70 to the south. These relationships, and particularly the larger consumer offerings in both Manhattan and Topeka, impact local spending potential and local business competitiveness considerations. Residents working in neighboring communities are more likely to shop and patronize these communities. Local businesses seeking to capture more local spending should consider offerings, services, convenience, and hours to enhance competitiveness.
Household Types. Esri provides detailed profiles of unique household types (i.e., Tapestry Segmentation Profiles). Every American household is identified with one of 64 household types. Wamego has seven unique household types. The Esri Tapestry Segmentation Area Profile provides both summary and detailed background information for each of these groups. This information can be used to gain insight on the consumer characteristics and preferences of Wamego’s permanent residents. The following is quick summary of Wamego’s household types:
| Top Five Household Types | * | % Total | Cumulative % |
|---|---|---|---|
| 1 Green Acres | (6A) | 26.1% | |
| 2 Salt of the Earth | (6B) | 19.4% | 45.5% |
| 3 Bright Young Professionals | (8C) | 16.7% | 62.2% |
| 4 Rustbelt Traditions | (5D) | 14.4% | 76.6% |
| 5 Prairie Living | (6D) | 13.9% | 90.5% |
| Remaining Household Types | |||
| 6 Middleburg | (4C) | 9.3% | 99.8% |
| 7 Southern Satellites | (10A) | 0.3% | 100.1% |
Household Budget Expenditures. Given the focus of this analysis, we suggest spending some time with Esri’s Household Budget Expenditures profile. This profile provides detailed household spending potential information. Esri estimates that the permanent residents of Wamego (Zip Code 66547) have a total spending potential of $243 million in 2018 with a spending potential index of 101 or slightly higher compared to the U.S. averages.
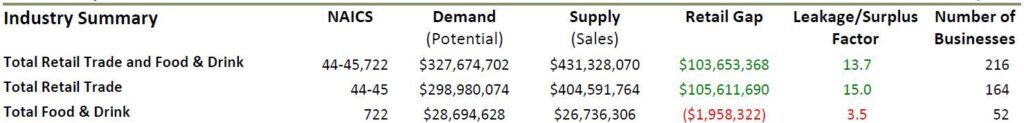
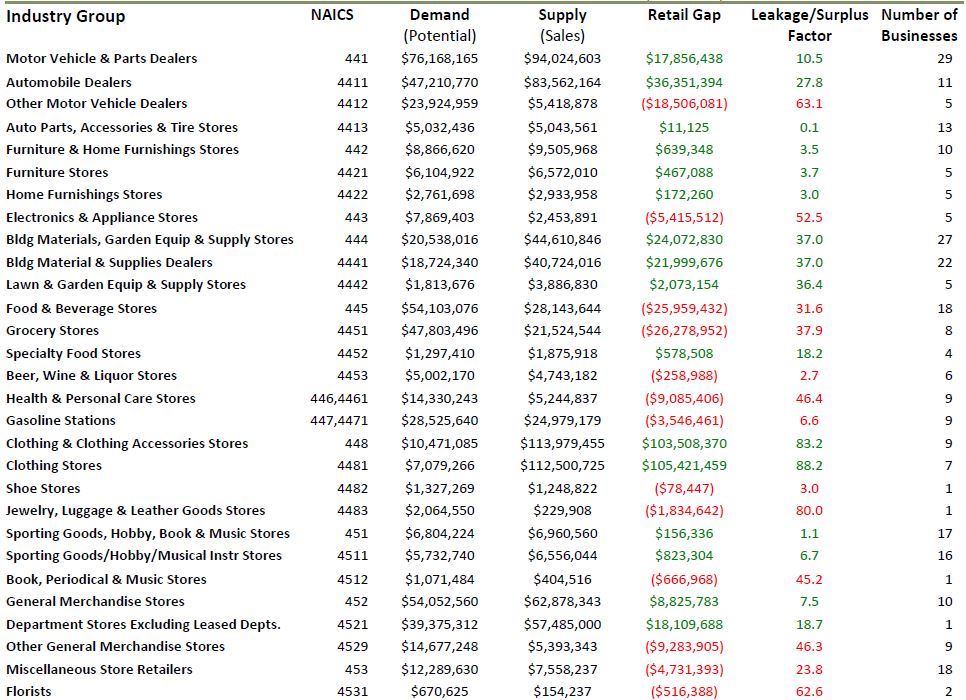
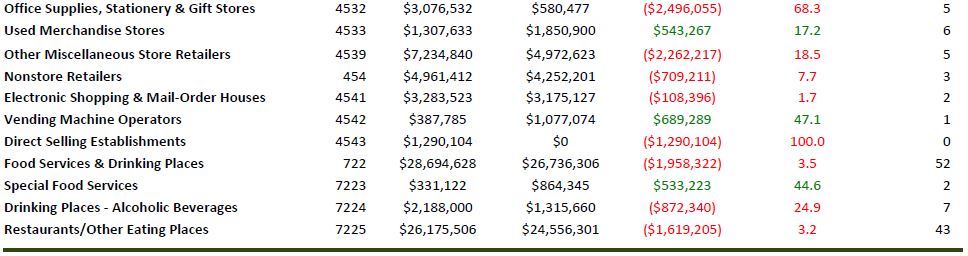
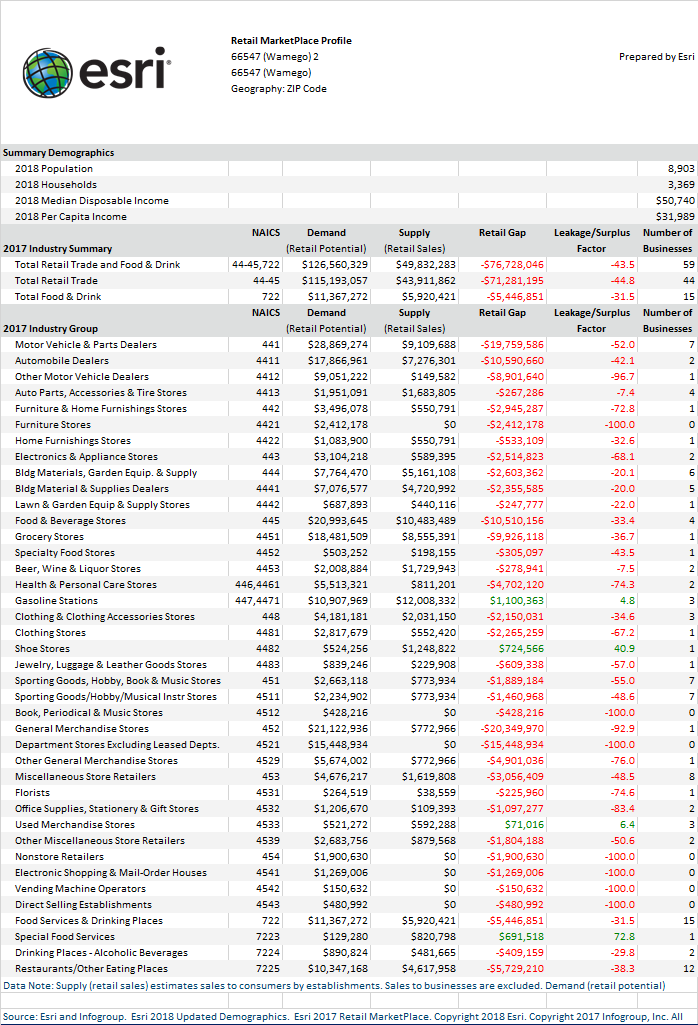
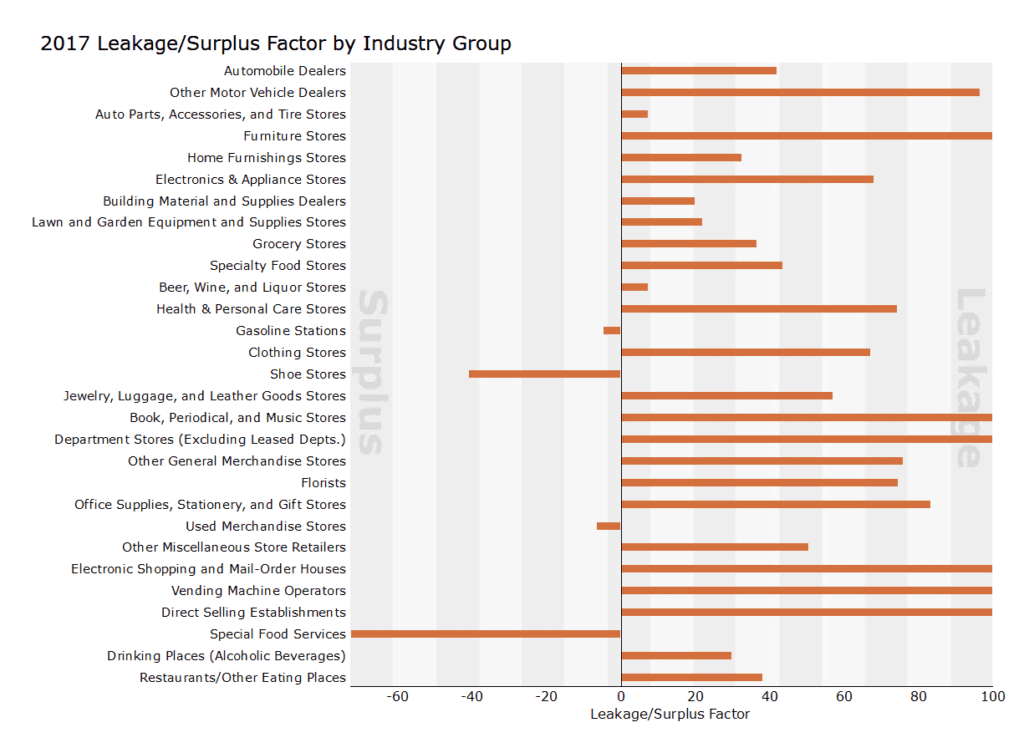
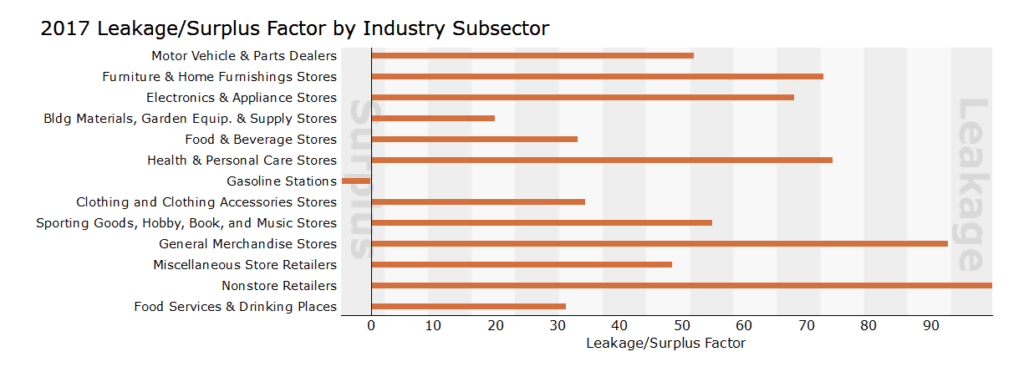
Retail Demand, Supply and Leakage Rates. Esri provides a detailed Retail MarketPlace Profile for Wamego. In our previous work for your community, we have provided similar data for Pottawattamie County. Remember… this report provides only spending information for “retail activities” and does not include the larger set of “service” related spending (e.g., banking, insurance, health care, etc.) Focusing just on actual estimated retail spending activity (includes all consumer group spending) Esri finds the following:
- Retail Demand $127 million
- Retail Supply $50 million
- Retail Spending Leakage $77 million
The relatively high retail spending leakage rate is to be expected given Wamego’s relationship with Manhattan, Topeka, and other communities. However, this leakage rate also offers development opportunities. While Wamego is likely to always have spending leakages, there is significant opportunity for local spending capture given this data.
Detailed Sector Centered Profiles. Esri provides a collection of both “Expenditure Profiles” and “Market Potential Profiles” ranging from financial services to health care to personal and beauty items. To illustrate the detail of these profiles we have include the Restaurant Market Potential profile. This profile provides detailed information on relevant “products” and “consumer behavior” estimating the “expected number of adults” engaging in this particular consumer activity (visiting a “family steakhouse”), percent of total adults and the market potential index. These profiles can provide more granular data on potential business development opportunities.
(e2 Entrepreneurial Ecosystems, 2019)