K-12 Education
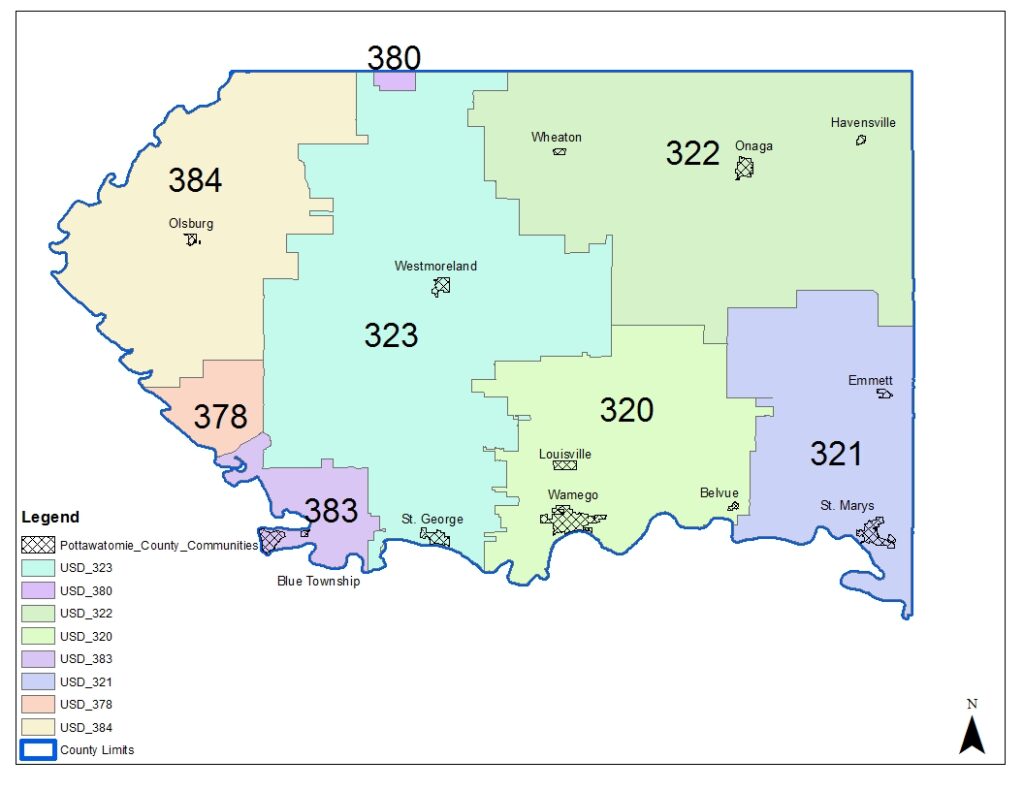
Pottawatomie County’s K-12 education is comprised of eight Unified School Districts. Below is a map showing the territories of each USD.
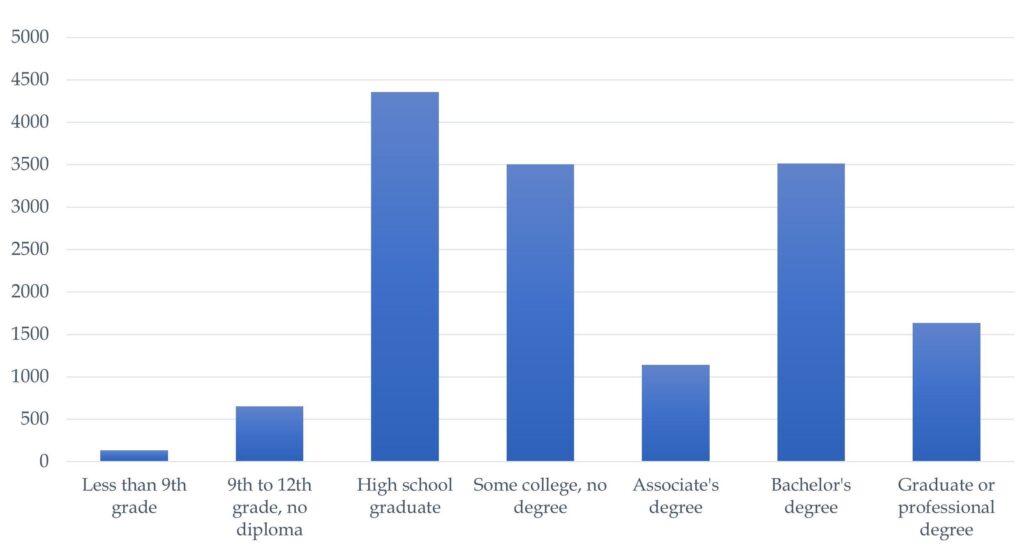
Educational Attainment in Pottawatomie County, Population 25 years and over (2018 Estimate)
Seven out of eight School Districts in Pottawatomie County have a higher graduation rate than the State of Kansas’s average graduation rate of 87.3%.
Graduation Rate (4-Year Cohort) and Dropout Rate by School District in Pottawatomie County 2018-19
| School District | USD | Graduation Rate | Dropout Rate |
|---|---|---|---|
| Wamego | 320 | 89.1% | 0.7% |
| Kaw Valley | 321 | 92.3% | 0.4% |
| Onaga-Havensville-Wheaton | 322 | 90.0% | 1.7% |
| Rock Creek | 323 | 94.4% | 0.2% (2017-18) |
| Riley | 378 | 94.4% | 0.9% |
| Vermillion | 380 | 100.0% | 0.0% (2015-16) |
| Manhattan-Ogden | 383 | 82.3% | 2.3% |
| Blue Valley | 384 | 92.3% | 1.2% |
The pupil-teacher ratio is the number of students who attend a school divided by the number of teachers in the institution. Numerous sources argue that lower pupil-teacher ratios are better at teaching students complex subjects, such as physics, mathematics, and chemistry, than those with a higher ratio of students to teachers. Compared to the national average of approximately 16.1 and the state of Kansas pupil-teacher ratio of 15.5, Pottawatomie County reached a good ratio of 13.6 in 2017-18.
Pupil-Teacher Ratio in Pottawatomie County
| School Year | FTE Enrollment September 20 | Total FTE PK-12 Teachers | Pupil-Teacher Ratio |
|---|---|---|---|
| 2014-15 | 3,824.6 | 290 | 13.2 |
| 2015-16 | 3,816.2 | 295 | 12.9 |
| 2016-17 | 3,953.2 | 294 | 13.1 |
| 2017-18 | 3,989.9 | 293.3 | 13.6 |
School Tax Rates, by County and School District, 2017-18
| School District | USD | FTE Enrollment | Total Assessed Valuation per Pupil |
Total Assessed Valuation |
Total School Mill Level |
|---|---|---|---|---|---|
| Wamego | 320 | 1,523.3 | 62,448 | 95,127,057 | 52.85 |
| Kaw Valley | 321 | 1,087.0 | 302,039 | 328,316,108 | 36.84 |
| Onaga-Havensville- Wheaton |
322 | 304.0 | 87,055 | 26,464,82 | 45.39 |
| Rock Creek | 323 | 1,079.9 | 56,951 | 61,501,310 | 60.08 |
High School Graduate Destinations by School District 2017-2018 (by number of students)
| 4 Year College | 2 Year College | Tech. College | Employment | Military | |
|---|---|---|---|---|---|
| Wamego | 41 | 32 | 17 | 12 | <10* |
| Kaw Valley | 40 | 16 | 20 | 10 | <10 |
| Onaga-Havensville- Wheaton |
11 | <10 | <10 | <10 | N/A |
| Rock Creek | 35 | 20 | <10 | <10 | N/A |
| Riley | 19 | 15 | N/A | N/A | <10 |
| Manhattan-Ogden | 255 | 108 | 34 | 104 | 20 |
| Vermillion | 19 | <10 | <10 | <10 | <10 |
Source: Kansas State Department of Education, https://datacentral.ksde.org/report_gen.aspx (Retrieved July 2019)
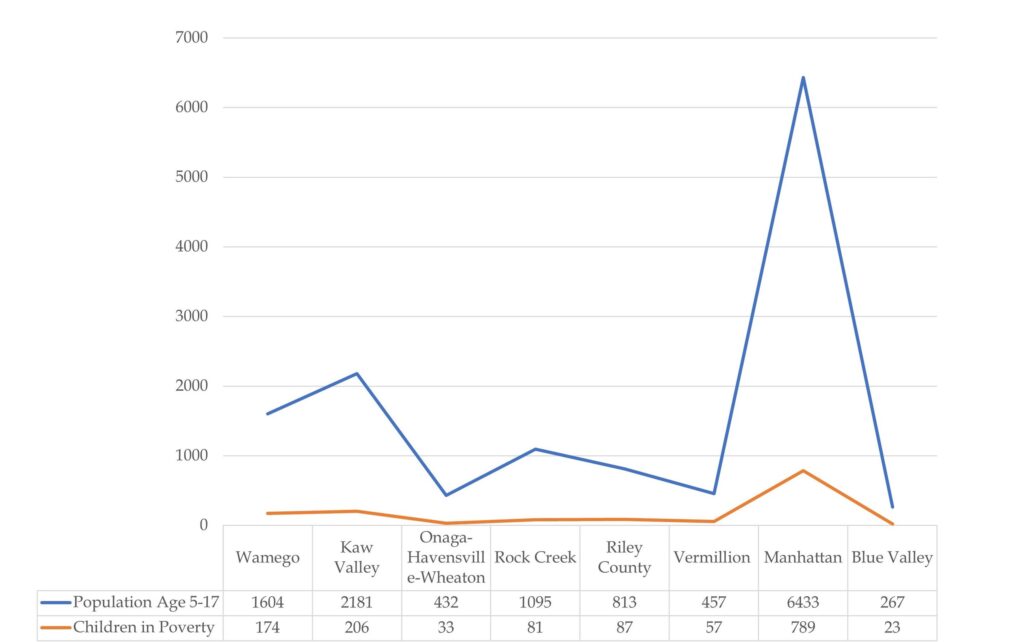
Growing up in poverty is one of the greatest threats to healthy child development. Poverty and financial stress can impede children’s cognitive development and their ability to learn. It can contribute to behavioral, social and emotional problems, and poor health. According to the National Kids Count (a project of the Annie E. Casey Foundation to track the well-being of children in the United States), 14% of children (age 5-17) in Kansas were in poverty in 2016 and 2017. The line graph below clearly demonstrates the lower rate of poverty estimate in eight school districts of Pottawatomie County in 2017.
This indicator is included in the KIDS COUNT Child Well-Being Index. Read the KIDS COUNT Data Book to learn more: http://datacenter.kidscount.org/publications.
Estimates of Poverty by School Districts (2018)
Transportation Information (2019-2020)
| Number of students living in the district who are transported at district expense and live 2.5 miles or more from their school |
Number of students living in the district who are transported at district expense and live less than 2.5 miles from their school |
Number of students not living in the district who are transported at district expense |
Total number of students who are transported at district expense |
|
|---|---|---|---|---|
| Wamego | 441 | 168 | 103 | 712 |
| Kaw Valley | 380 | 85 | 0 | 465 |
| Onaga- Havensville- Wheaton |
157 | 37 | 9 | 203 |
| Rock Creek | 679 | 143 | 0 | 822 |
| Riley | 410 | 37 | 55 | 502 |
| Manhattan-Ogden | 2,961 | 573 | 11 | 3,545 |
| Vermillion | 287 | 38 | 64 | 389 |